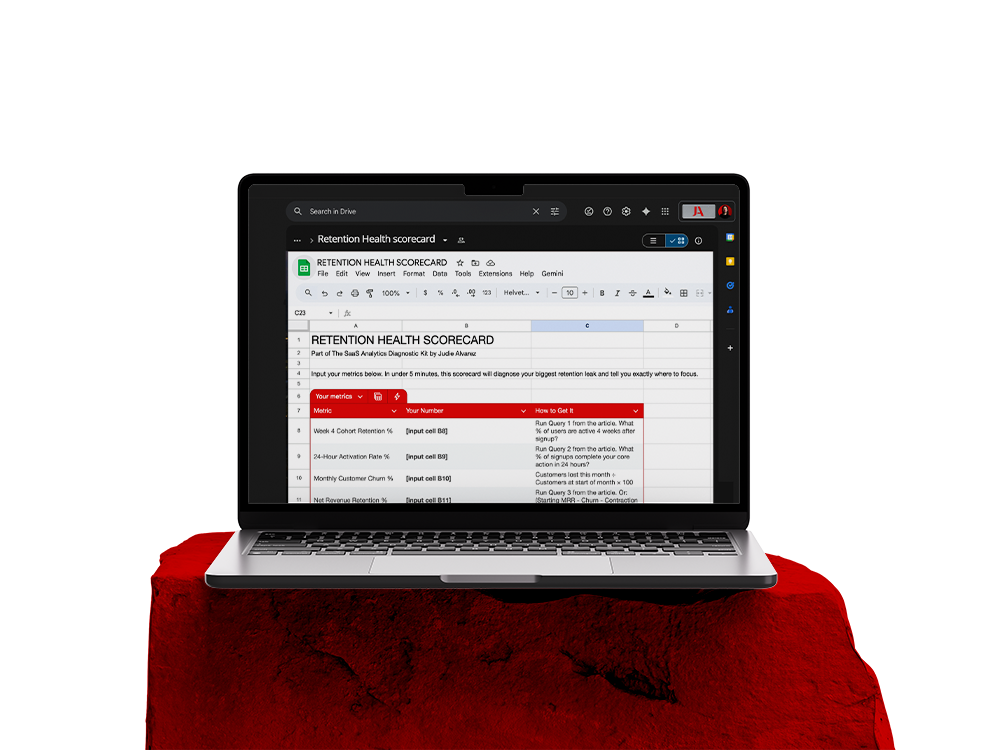
Retention Health Scorecard
Your dashboard shows averages. This scorecard shows problems.
Input 5 metrics. Get a diagnosis against 2026 benchmarks. Know exactly where your SaaS is leaking.
One Google Sheet. Five inputs. Instant diagnosis.
The problem with your current metrics:
- •Average churn hides new-user churn
- •Total signups counts ghosts who never activated
- •Logo retention masks revenue contraction
- •Your dashboard blends everything into a comfortable lie
You don't need better dashboards. You need diagnosis.
What You Get
The Retention Health Scorecard includes:
- ✓5-Metric Input Section (cohort retention, activation rate, churn, NRR, GRR)
- ✓Auto-Diagnosis with color-coded status (🟢 🟡 🔴) for each metric
- ✓"What It Means" interpretation for every score
- ✓Priority Action that identifies your biggest leak and tells you what to fix first
- ✓2026 Benchmark Reference with sources (SaaS Capital, High Alpha, ChartMogul, Userpilot)
How It Works
No interpretation required. The scorecard tells you what's broken and what to do about it.
2026 Benchmarks Inside
| Metric | SMB | Mid-Market | Enterprise |
|---|---|---|---|
| Net Revenue Retention | 90-105% | 105-115% | 115-125% |
| Gross Revenue Retention | 85%+ | 90%+ | 94%+ |
| Monthly Churn | <7% | <5% | <3% |
| Activation Rate | 30%+ | 36%+ | 40%+ |
| Week 4 Retention | 50%+ | 60%+ | 70%+ |
Sources: SaaS Capital 2025, High Alpha 2024, ChartMogul 2024, Userpilot 2024, UserMotion 2024.
Who This Is For
You ran the SQL queries from the article (or pulled the data from your analytics tool).
Now you have numbers. But you don't know if they're good or bad.
You want a simple answer: where is my SaaS leaking, and what should I fix first?
This scorecard gives you that answer in 30 seconds.
This Is Free. Here's Why.
I'm Judie. I help seed-stage founders diagnose and fix retention problems.
Most founders look at averages and feel okay. Then they're surprised when growth stalls. The problem was always there. The metrics just hid it.
This scorecard forces you to see the truth. Five numbers. Color-coded diagnosis. No hiding.
If the scorecard shows red and you want help fixing it, we can talk. But first, get the diagnosis.
FAQ
Stop guessing. Start diagnosing.
You'll get it in 2 minutes. Input your numbers. See the truth.
P.S. Your "healthy" metrics might be hiding a leaky bucket. This scorecard will tell you.